Έρευνα δείχνει ότι το μεγαλύτερο μέρος των Bitcoin δεν ξοδεύετε
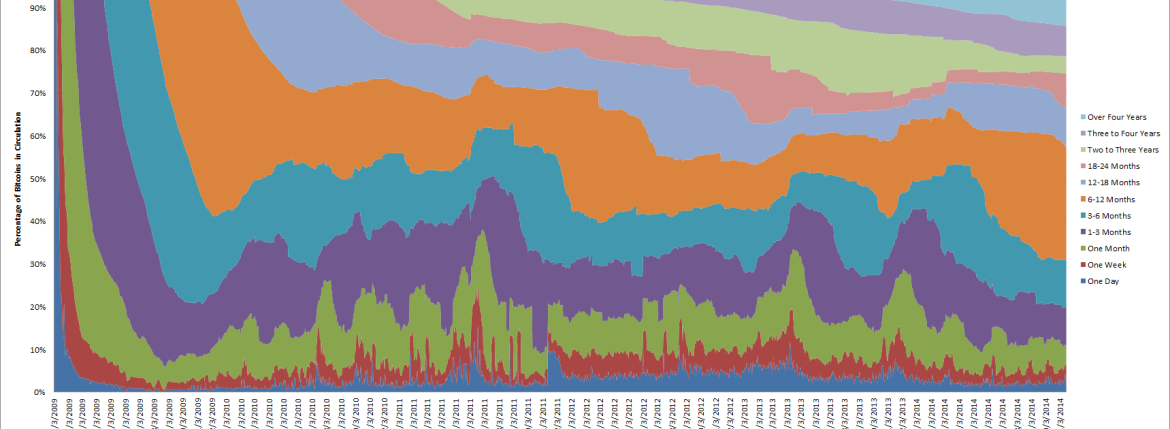
O John Ratcliff μηχανικός της Nvidia δημοσίευσε σήμερα στο Reditt ένα διάγραμμα για την παγκόσμια κίνηση των Bitcoin μέσω του συστήματος συναλλαγών Blockchain κατά την διάρκεια των χρόνων.
“This graph shows, I believe, a reasonable measure of ‘liquidity’, in other words a measure of all bitcoins in existence, how many move each day, week, month, etc.”
Στην συνέχεια ο Tim Swanson συγγραφέας και ενεργό μέλος της κοινότητας του Bitcoin σε ανάλυση που έκανε κατέληξε στο συμπέρασμα ότι το 70% των Bitcoin μένουν ανενεργά στα ψηφιακά πορτοφόλια και η μηνιαία ρευστότητα στην ψηφιακή αγορά κυμαίνετε στο 10%
1) that token movement (velocity) strongly correlates with a rapid increase in market prices (e.g., more velocity during the bull runs, less during price decreases); you can see that in the first chart with large bumps in April 2013 and then again in November 2013
2) because of the large dip in prices over the past year, most tokens are inactive in part because the owners are still “underwater”
3) that monthly liquidity is still only around 10% (more on consumption below)
4) the “tx volume” chart on Blockchain.info is no longer entirely valid due to a combination of the usual mixing and mining rewards but also because of increased advertisement spam (e.g., metadata within OP_RETURN), increase in P2SH andCounterparty tx’s. Only a full traffic analysis can provide a more accurate breakdown.
Τα πλήρη συμπεράσματα του μπορείτε να τα διαβάσετε στο προσωπικό του blog εδώ
